Create high-quality maps with OOoHG
Creating maps is by no means an easy task. While there are a few open-source Geographical Information System (GIS) applications available for Linux, they are all geared towards professional users, and as such they have quite a steep learning curve. Even if you manage to master a GIS application, you still have to produce maps, or find pre-made map templates, which quite often are rather expensive. Fortunately, there is an easy-to-use software package called OOoHG that includes everything you need to create virtually any type of map. OOoHG is not a standalone application, but a huge collection of maps and mapping elements stored as OpenOffice.org Gallery files. This means that instead of learning a completely new application, you can use OpenOffice.org’s familiar tools. Better yet, the entire process of designing a map can be done via drag-and-drop. However, there is one drawback. OOoHG is developed with French users in mind, and its documentation is available in French only. But don’t despair, the following article will help you to get started with this amazing map library.
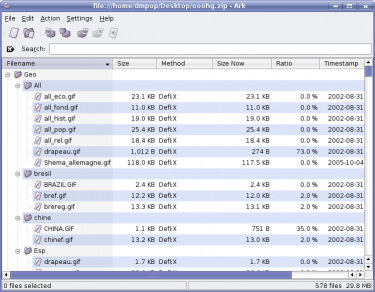
Figure 1: OOoHG is an extensive library that resides in the gallery folder inside OpenOffice.org
OOoHG's contents
The core of OOoHG consists of three libraries. CART’OOo is designed to quickly create maps and geographical drawings. It consists of 207 vector-based geographical and historical maps divided into 13 themes and 153 “geographical objects” that can be used to create maps, legends, drawings, etc. The CHRON’OOo library is designed specifically for creating chronological timelines using the supplied objects. ATLAS’OOo allows you to create bitmap maps using 226 geographical and 187 historical maps.
Downloading and installing OOoHG
To download the latest version of OOoHG, point your browser to http://ooo.hg.free.fr/ooohg/ooohg.html, locate the OOoHG.zip
file on the page, and download it to your computer. Unpack the archive
using your favorite archiving tool; on KDE, left-click on the file and
choose Extract → Extract to ooohg/. This creates the ooohg folder
containing the unpacked files. Now move the contents of the ooohg
folder to the /home/username/.openoffice.org2/user/gallery directory, where “username” is your user name. Note that to access the invisible .openoffice.org2
folder, you must enable the Show Hidden Files feature in your file
browser. Once the files are copied, launch OpenOffice.org Draw, and
click on the Gallery button, or choose Tools → Gallery. This opens the
Gallery window, and if the OOoHG library has been installed properly,
you should see the OOoHG themes in the Themes pane. By default, all the
themes have French names, but you can easily rename them: left-click on
the theme you want, select Rename, and give the theme a new name.
OOoHGx.x.exe installer, and it does all the donkey work for you.Creating a map
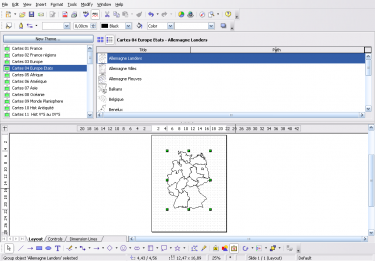
Figure 2: Creating a map is as simple as dragging it from the Gallery onto the drawing
Now it’s time to design a map, and for this article we design a map of Germany. In the Themes pane, select the Cartes 04 Europe Etats, and from the gallery pane select the Allemagne Landers map (to quickly locate the appropriate map, you might want to switch to list view). Drag and drop the map onto a blank drawing. As you may know from your geography classes, Germany consists of several federal states (or just states), and you can see their borders on the map. As it is, the map is pretty bare-bones, and you can spice it up a bit by applying different colors to the states. But before you do that, it is important to understand how OOoHG’s vector-based maps are made. Each element on the map is drawn using Bézier curves, and once all the elements are done, the map is “assembled” using the Group tool, so it acts as a single vector drawing.
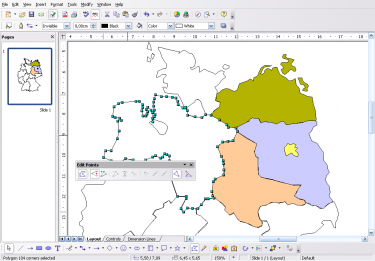
Figure 3: Each element of the map is drawn using Bézier curves
To see why this is important, let’s put some colors on the Berlin and Brandenburg states. To modify the individual elements of the map, select the entire map by clicking on it, then choose Tools > Enter Group (or press F3). Now select the Berlin state, left-click on it and select Edit Points. Alternatively, you can either choose Edit → Points or press F8. In the Edit Points toolbar, press the Close Bézier button, then select the color you want from the Area Style/Filling drop-down list in the Line and Filling toolbar. Repeat these steps for each element (state) on the map. Once you’ve colored the map, leave the Edit Points mode by pressing F8. Now you have a professionally-looking map, but the fun doesn’t have to stop here. OOoHG includes an impressive collection of design elements that you can use to add virtually any type of information to the map. For example, let’s add Berlin to the map. Select the Carto 1 Outils ponctuels géométriques theme, and drag the dd2269 element onto the map. Place it where Berlin is supposed to be, and adjust the circle’s size (to keep the circle’s proportions, press and hold the Shift key while resizing the circle with the mouse). Select the colors you like for the circle’s border and filling. Next, use the Text tool to add a city’s name so you identify it on the map. Want to turn your creation into a weather map? OOoHG has what you need. Select the Carto 2 Outils ponctuels expressifs theme and use the weather symbols (elements from dd2333 to dd2338) that represent different weather conditions.
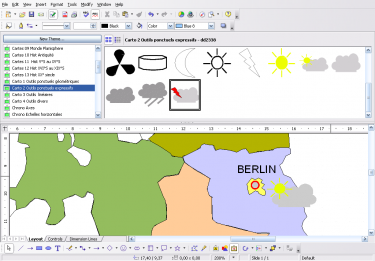
Figure 4: OOoHG includes a wide range of map elements including weather symbols
Creating interactive maps
The great thing about OOoHG is that it’s not limited to Draw: you can use it with other OpenOffice.org applications as well. And using OOoHG with Impress is particularly intriguing, since it allows you to create interactive maps. For example, you can create an interactive weather forecast for several days using Impress’s built-in tools and OOoHG.
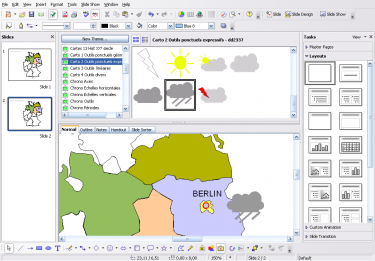
Figure 5: Using OOo Impress you can create interactive maps
Start with creating a blank Impression presentation. Since you already have the map of Germany with Berlin on it, you can just as well insert it from Draw into the presentation. Simply copy it in Draw and paste it into the currently selected slide in the presentation. Add a header to the slide, for example, Weather Today, and add the appropriate weather symbol from OOoHG Carto 2 Outils ponctuels expressifs theme to the map. Next, left-click on the slide in the Slides pane to the left and select Copy. Left-click anywhere in the Slides pane and select Paste. This creates a new slide identical to the original one. Replace the header with, for example, Weather Tomorrow, and replace the weather symbol with another one (assuming the weather is going to be different the next day, of course). To make the map a bit more snazzy, you can add transition effects to the slides.
Now you can impress your peers by showing them your interactive map, but you can also publish it on the Web either as a HTML or Flash presentation. To export your interactive map in Flash format, choose File → Export and select the SWF format from the File format drop-down list. This creates a Flash-version of the interactive map, but before you can publish it on the Web, you have to create an accompanying HTML page and embed the .swf file into it. The most basic code can be as follows (remember to substitute the “WeatherForecast.swf” with the name of your Flash file):
<html>
<body><object width="800" height="600">
<param name="movie" value="WeatherForecast.swf">
<embed src="WeatherForecast.swf" width="800" height="600">
</embed>
</object>
</body>
</html>
Exporting the map into an HTML-based presentation is equally easy. Choose File → Export and select the HTML format from the File format menu. This opens the HTML Export wizard that guides you through the entire process.
Final word
This article has barely scratched the surface of what you can do with OOoHG. This is a truly amazing package that allows you to create anything from historical maps and timelines to maps of population density and immigration charts. The best part, though, is OOoHG’s sheer ease of use: you can create professionally looking maps with minimum effort and export them in a variety of formats. If you need to create a map for your class or business presentation, look no further than OOoHG.
Related articles:
| Creating an e-wallet with Base | 2007/08/16 00:27 | Dmitri Popov |
| Digitally sign OpenOffice.org documents | 2007/08/16 00:29 | Dmitri Popov |
| Create high-quality maps with OOoHG | 2007/07/15 18:20 | Dmitri Popov |
